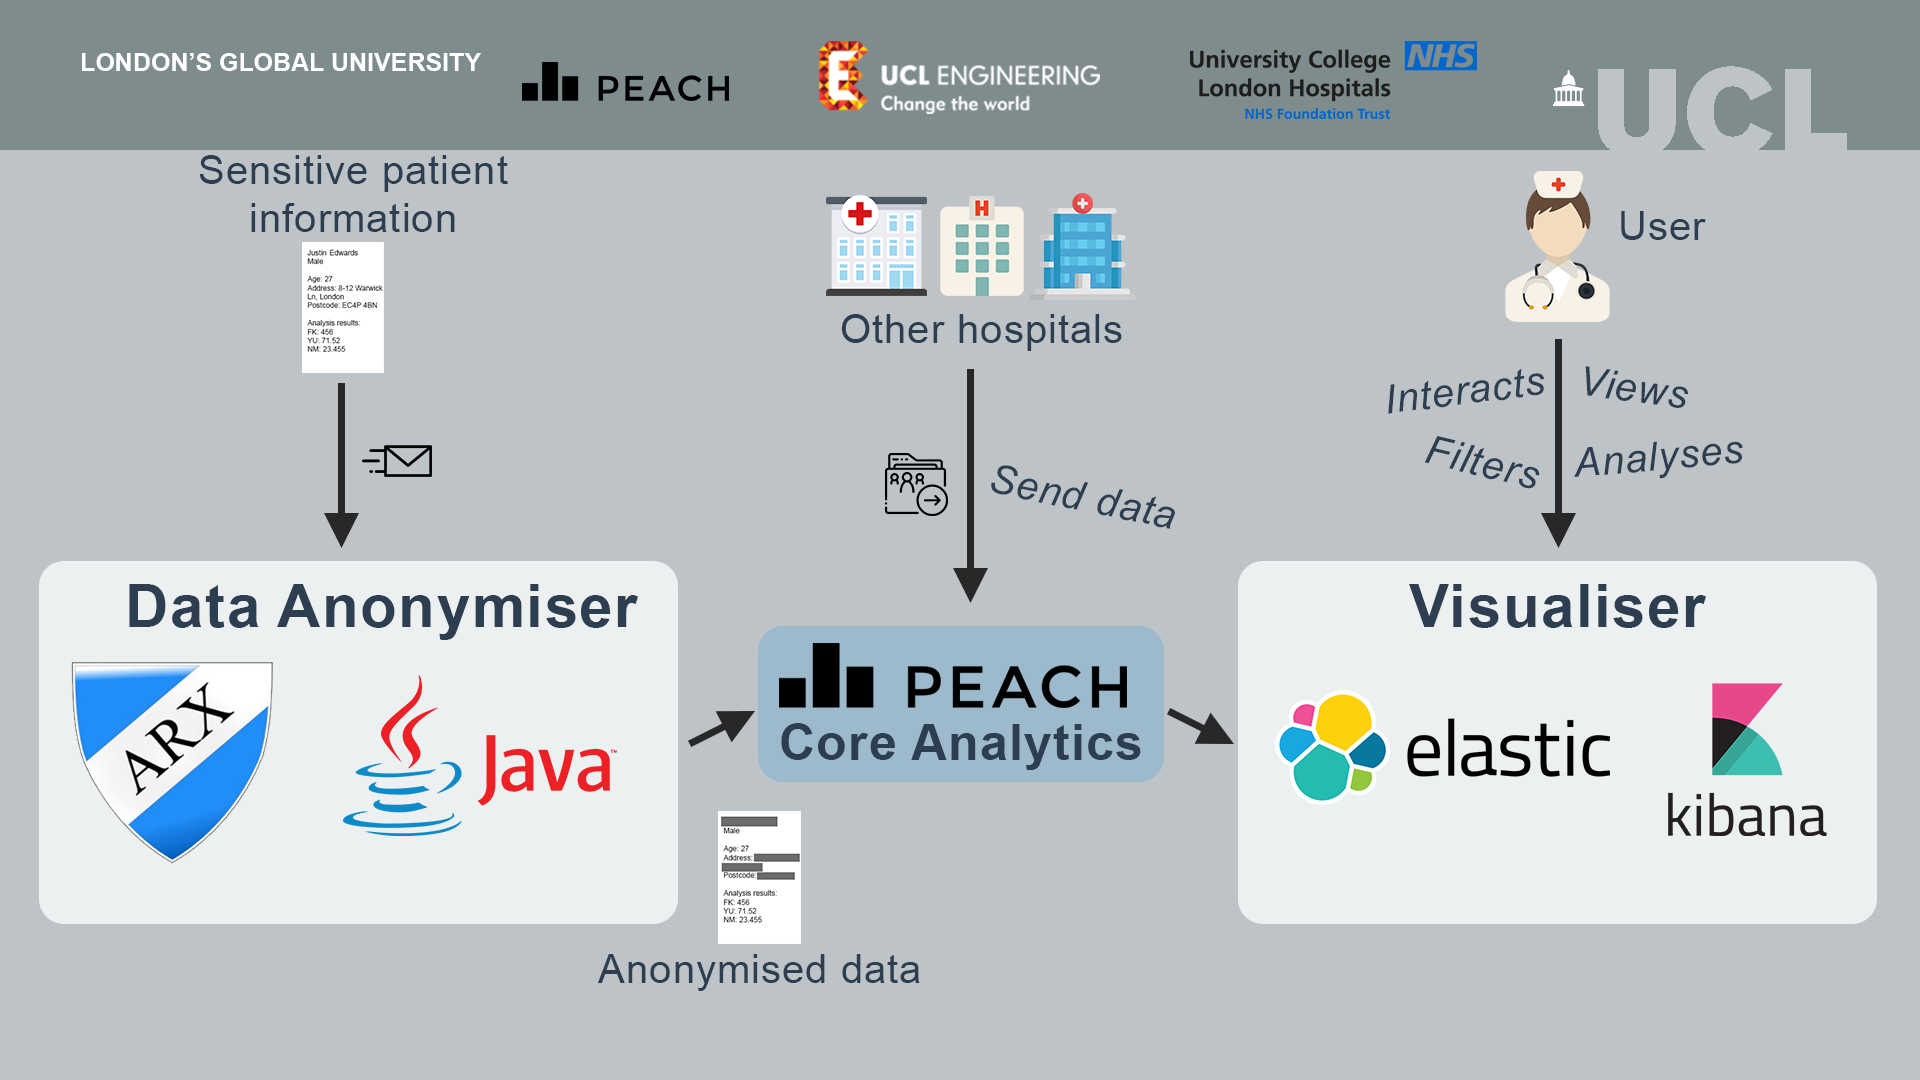
This page covers the system architecture, class diagrams, design/architectural patterns, data storage and implementation of key functionalities.
Our system consists of 2 parts, a data anonymisation tool and analytics visualiser.
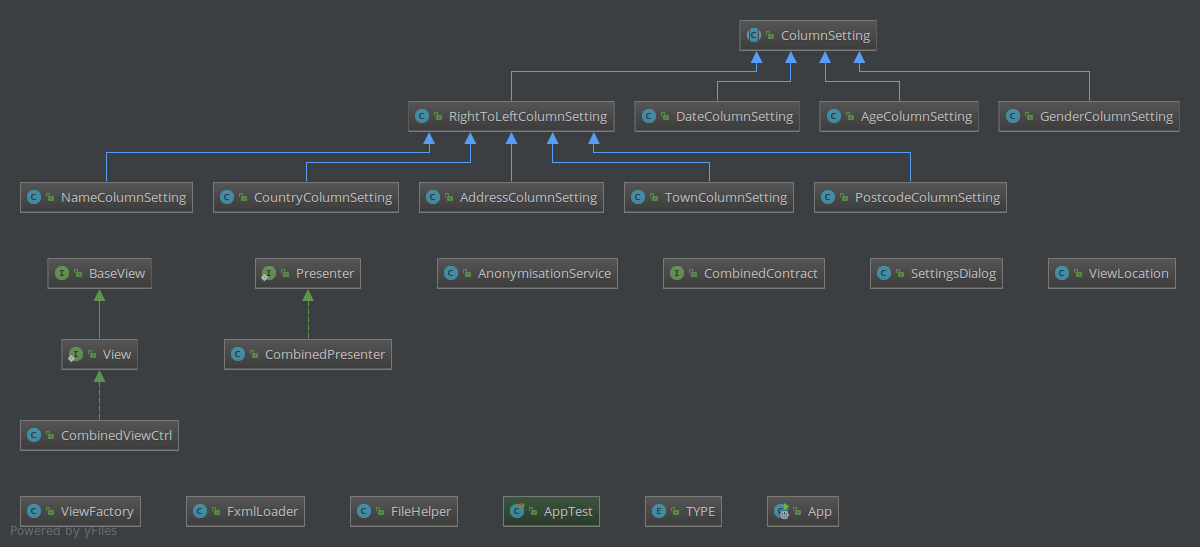
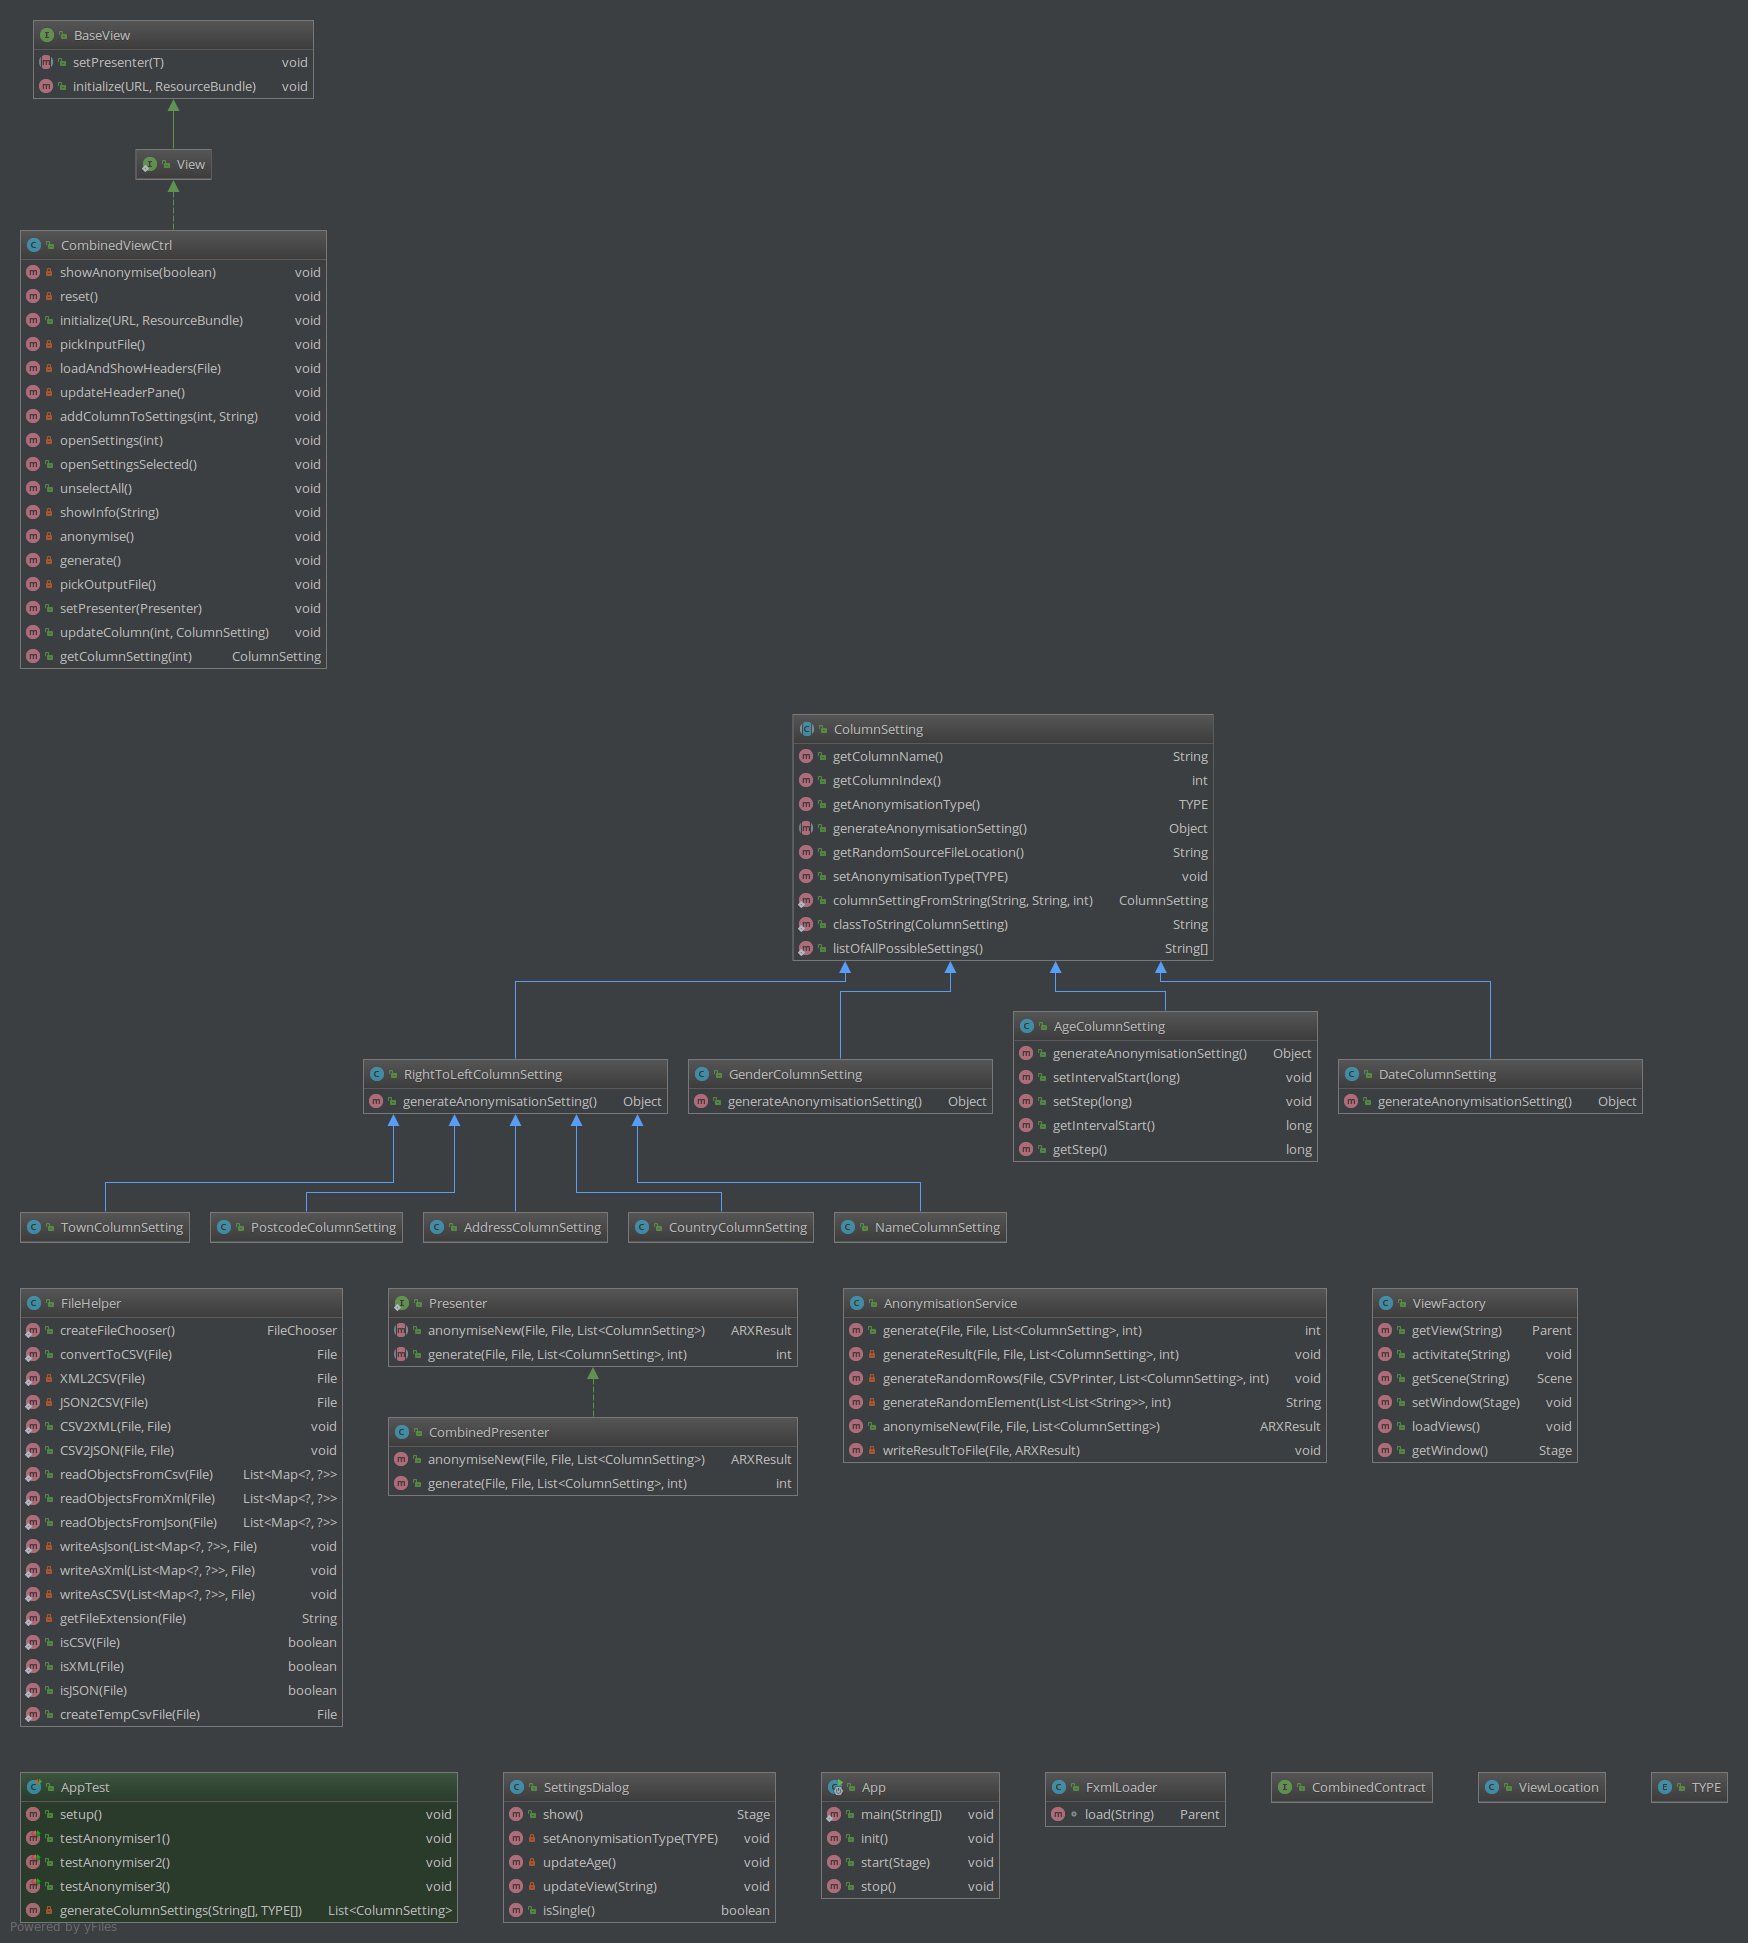
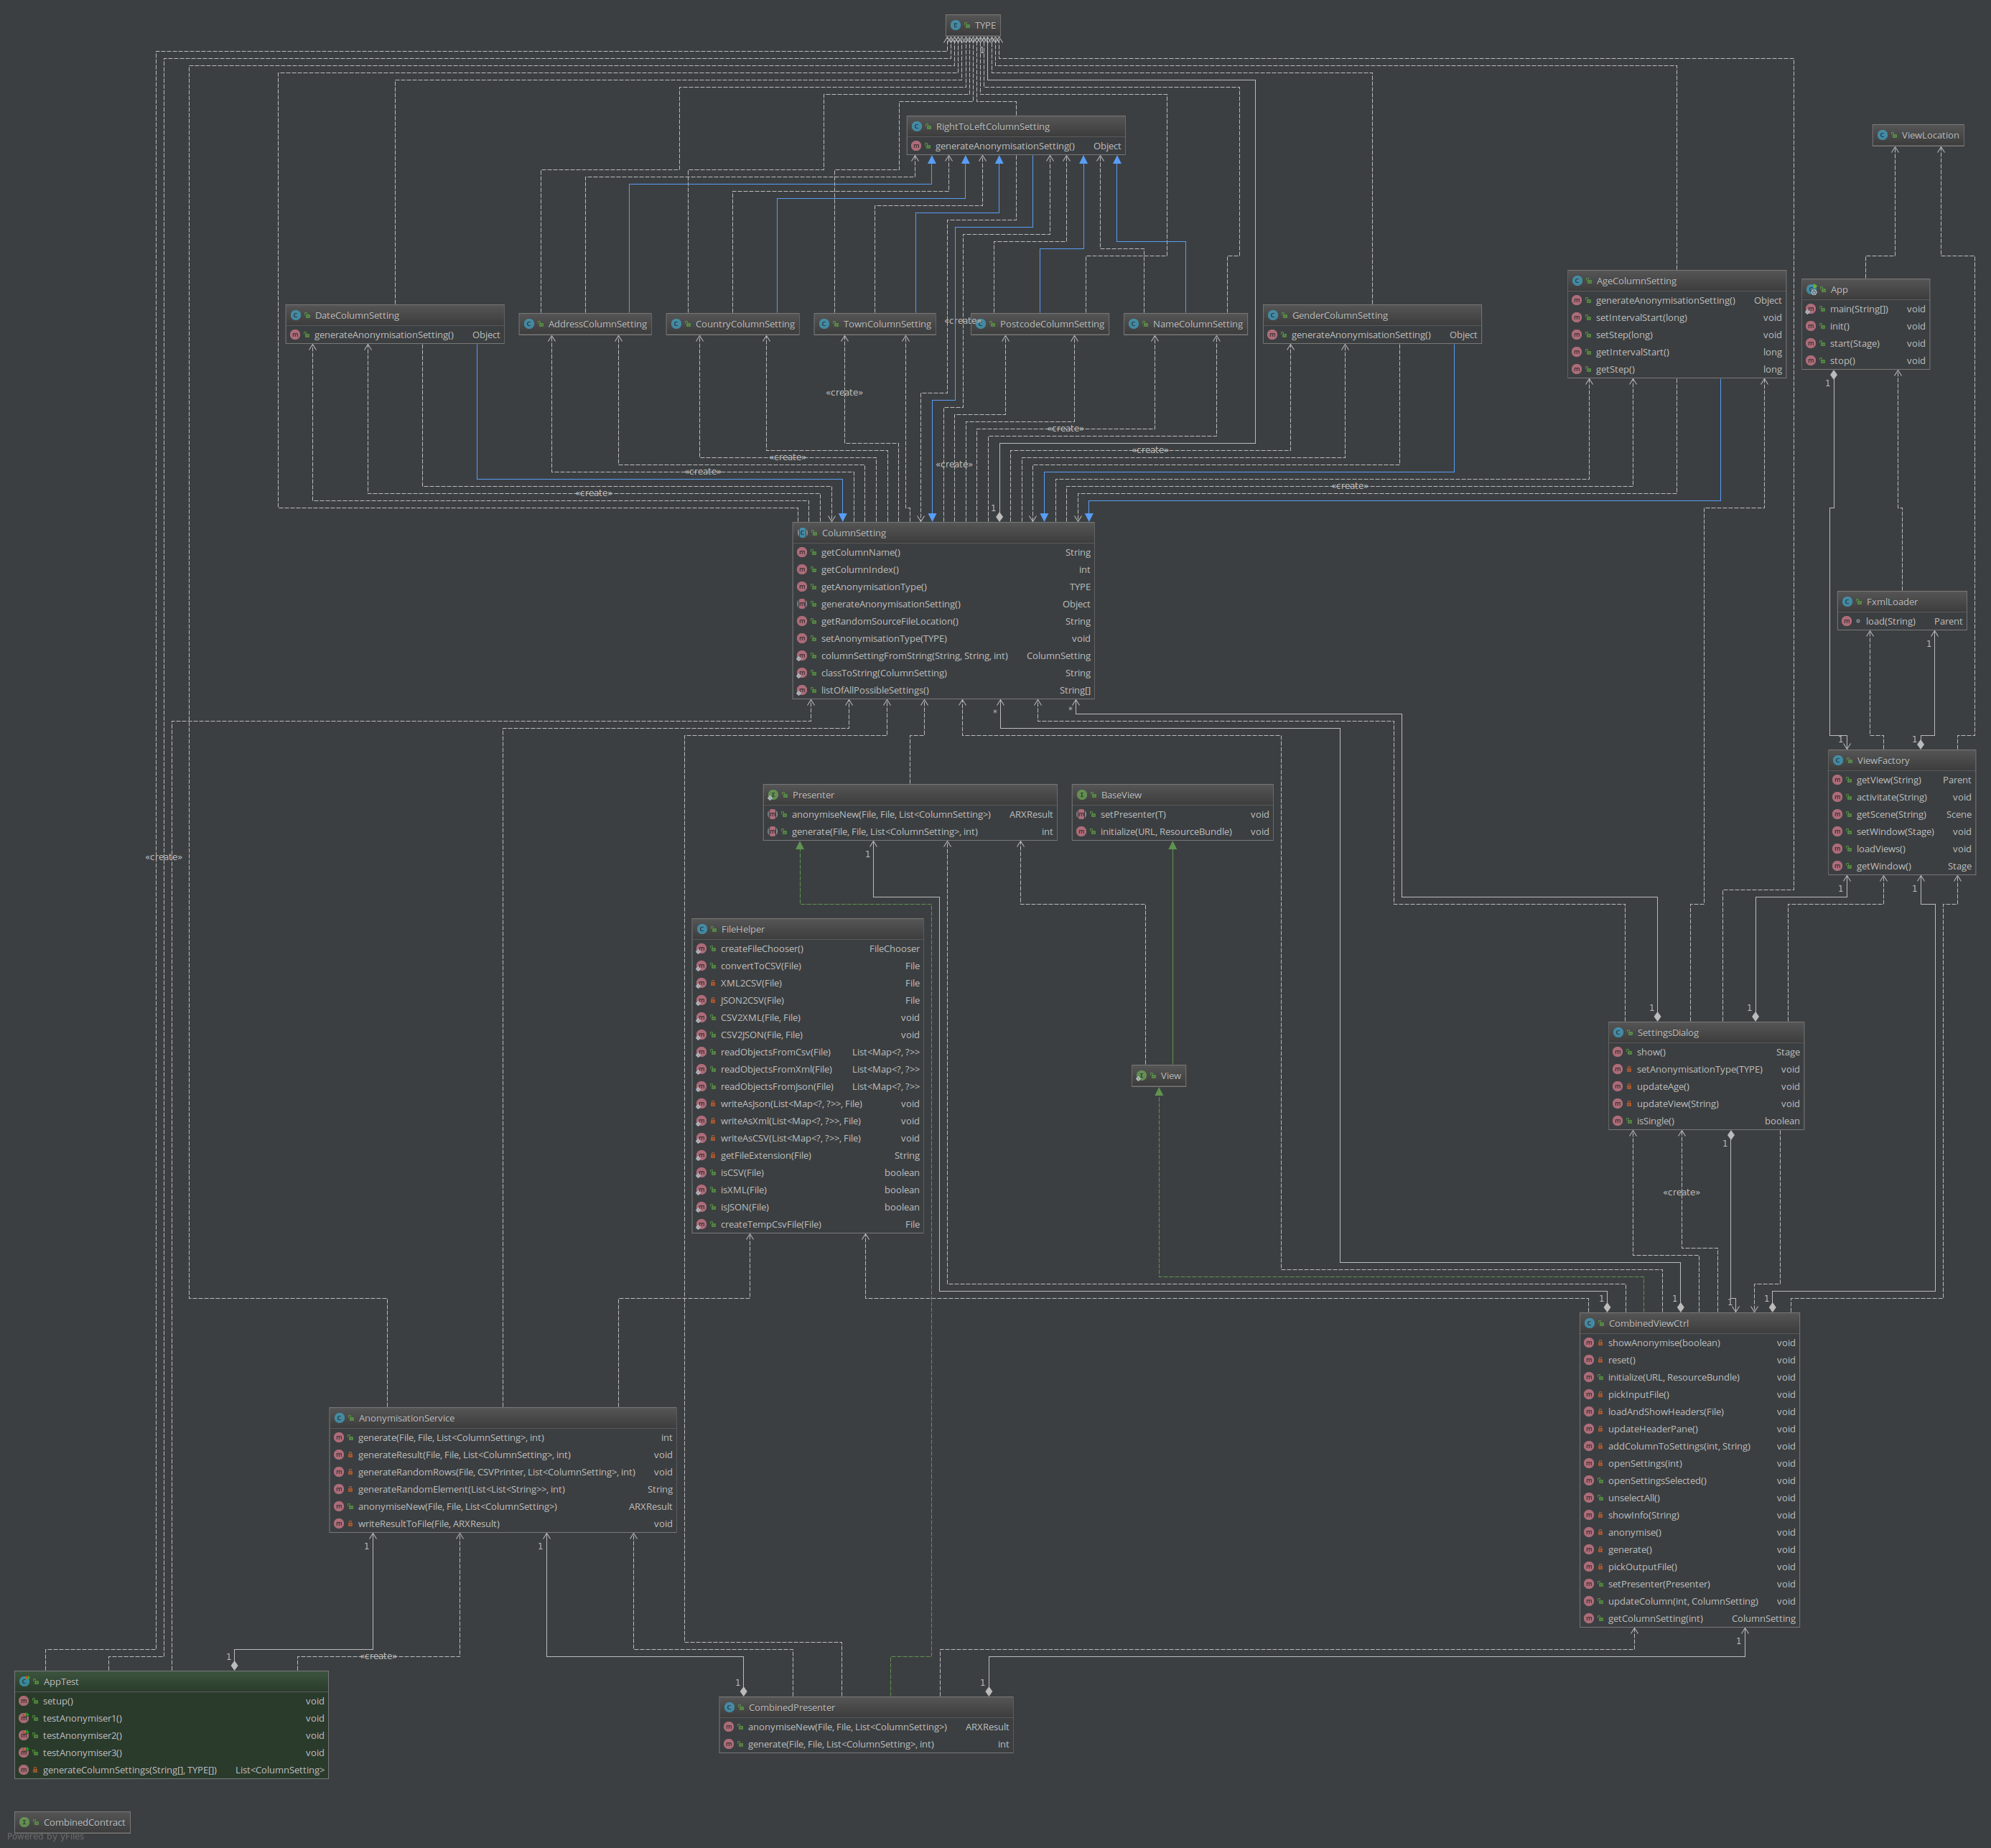
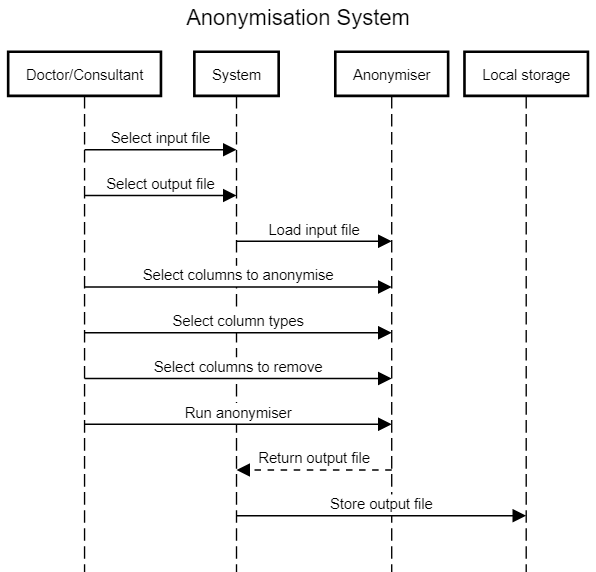
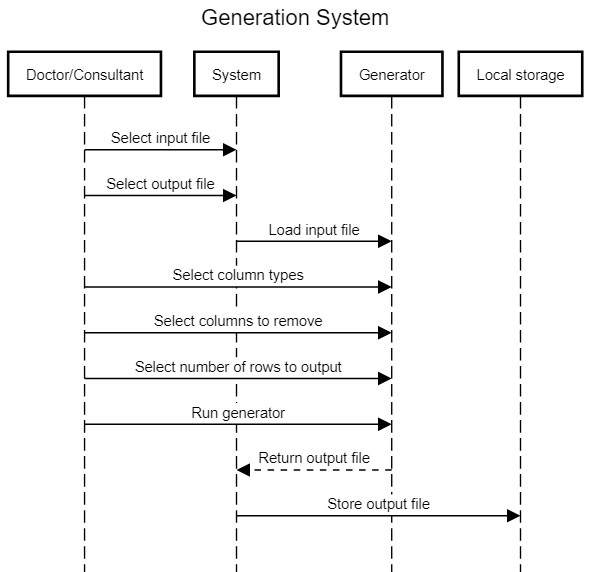
The data anonymisation tool is used by doctors to anonymise sensitive patient data for further research, data analytics processing and for statistical purposes. To do so a doctor selects an input file with sensitive patient information and chooses which parts of this data should be anonymised. Our solution produces a anonymised data file which can be sent to PEACH core analytics for further analysis. Programmed in Java, the anonymisation tool has a user interface written using Java FX and uses the ARX library for anonymisation.
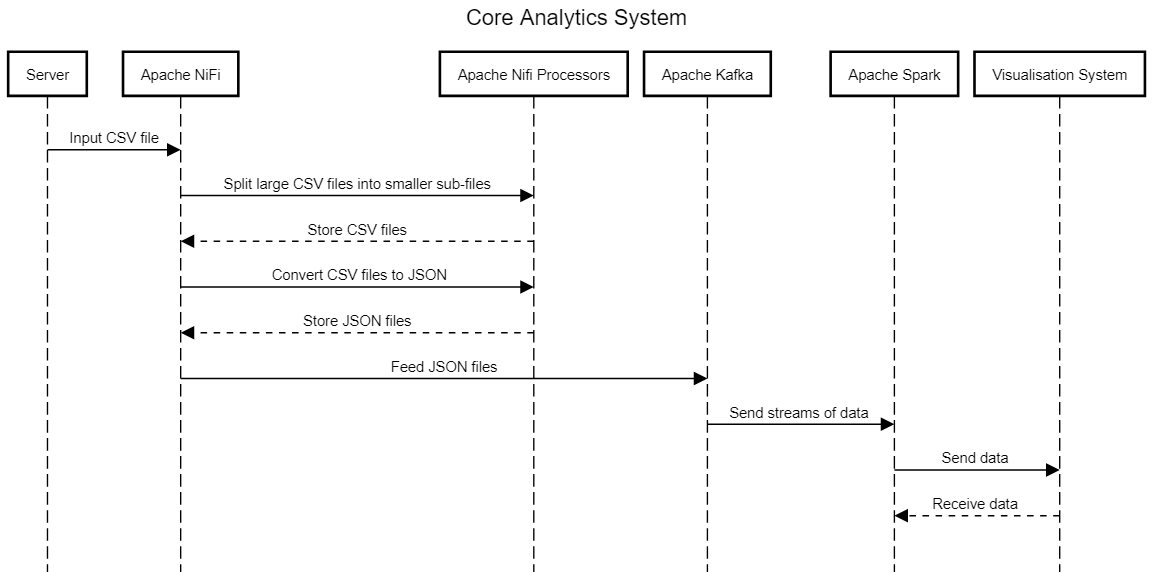
All the data which is processed by the PEACH core analytics system can be used in our visualiser. A data scientist can plot and customise graphs based on the input data. For example if a researcher wants to analyse the effectiveness of a new cancer treatment, these graphs could provide better insight into the results and potentially help to improve these medications. The visualiser is based on the Elastic stack and Kibana.
The 2 main classes for the user interface are: CombinedViewCtrl and CombinedPreseneter, which both follow the interface CombinedContract. SettingDialog contains the logic for the dialog where the user can change the column settings. Multiple classes override the ColumnSetting parent class by following the template pattern. The AnonymisationService contains the business logic for anonymising sensitive patient information and generating new data.
We are using Java and JavaFX as a GUI library to create the user interface in the data anonymisation tool and used the Model-View-Presenter design pattern to separate the view from the logic. In this pattern the view captures events (such as button clicks or text input) and passes this information to the presenter which contains all the business logic. In our case the presenter calls a service class which anonymises or generates data.
In the data anonymiser we have predefined multiple common column types (like age, gender, first name, last name, address, etc). Each of the column settings stores the column name, index, anonymisation type and a file with random values of this type. However, every column type follows different rules by which the anonymised data is produced. For example a column with patient age values can be converted to age ranges during the anonymisation, or names can be anonymised by leaving just the first letter. For this reason we chose the template pattern, which allows us to have a common superclass and many subclasses, each implementing their own anonymisation method. This method is overridden in every subclass. Furthermore we can generate a specific column setting object based on a name as a string and vice versa. We used this functionality to switch between column settings in the user interface.
The central part of the core analytics system is Apache Kafka, an open-source messaging broker. All the requests which enter the core analytics system pass through this brocker system. Kafka then distributes the tasks which need to be processed to different components. For example an anonymised dataset can be sent through Kafka to our visualiser tool and viewed by a researcher there.
In the layered pattern each layer provides an abstraction layer over the layers below it. In our case Azure provides an abstraction level over the datacenter hardware. The core analytics is installed on a Ubuntu VM, which in turn runs on Azure. Our visualiser solution uses data from the core analytics and provides an even further abstraction level by not only displaying raw data but also by generating graphs. The end user (doctors, researchers) only see the top level of the abstraction: graphs. Our system hides all the layers below it.
The core analytics platform is deployed on Azure and is the server part of our application. The data anonymisation tool generates an anonymised data file which can be uploaded to core analytics. The server listens for incoming data and after the file is uploaded, our server passes it to NiFi, which passes it to Kafka so that all PEACH systems can get access to this data.
In our core analytics system Apache Nifi accepts data coming in from the anonymiser and then delegates it to Apache Kafka which can then send it to multiple other components inside PEACH. NiFi listens for incoming files and starts working when such an event occurs. Furthermore, both the anonymiser and visualiser have a graphical user interface which fire events every time a user takes some kind of action like pressing a button or typing in a text field.
The anonymiser runs on local machines and receives an input as a data file in multiple formats: csv, json, xml. The anonymiser outputs the anonymised dataset to another file in one of these three formats.
The core analytics system and the data visualiser both run on Microsoft Azure in a Ubuntu virtual machine. The data uploaded to the core analytics system can be stored in Elasticsearch, a storage solution in the Elastic Stack. This data is stored, indexed and can be queried and accessed by our visualiser solution. Advantages of using Elasticsearch is the efficiency of queries and its scalability. Made up of nodes, the Elaticsearch can easily grow, store huge amounts of data and support a huge analytics system.
Our main task was to redesign the GUI and improve the features of the data anonymiser. To improve the user experience we changed and simplified the layout of the app by having just one view. Furthermore we used a material design library for JavaFX (JFoenix) to improve the appearance of the app. We have refactored the code of the previous team and made it a lot easier for the next team to improve on the existing features. For instance the template design pattern allows to easily add new predefined column types. The ARX library helps us anonymise the data. It uses the input file and the settings chosen by the user to generate an anonymised output file. A major feature we have added is the ability to automatically detect the column type and the possibility to choose between predefined data types. Overall, we simplified the whole user experience and ease-of-use.
The second major part of our system is the data visualiser. Our task was to create a visualiser solution and connect it to the existing PEACH core analytics system. For this we have deployed the Elastic Stack and Kibana on Azure. We use Kibana as the basis for our visualiser tool.
Core analytics, the main part of the PEACH system was developed by a previous team. To connect our anonymiser and visualiser to core analytics we first had to run and test the core analytics system. We first ran the all the part of the core analytics system (Apache Nifi and Apache Kafka) on a local machine and created a deployment script to simplify the whole process. After completing both the visualiser and the anonymiser, we conducted multiple integrations tests by running all parts of the system on one local machine. We saw that all parts can communicate and work together. Next, we deployed core analytics and our visualiser tool on Azure using a Ubuntu virtual machine. In the process we also wrote a deployment script which creates and installs all necessary packages on Azure. Next, the web server is written in Python Flask and receives, stores and sends data to the analytics system. The web server carries out file integrity and format checks and ensures that only the valid files are passed on.