We carried out integration testing of the anonymiser and visualiser with the core analytics system. First we deployed all parts of our system on one local machine. We then ran through all parts of the system, making sure that at every point the correct data is being processed.
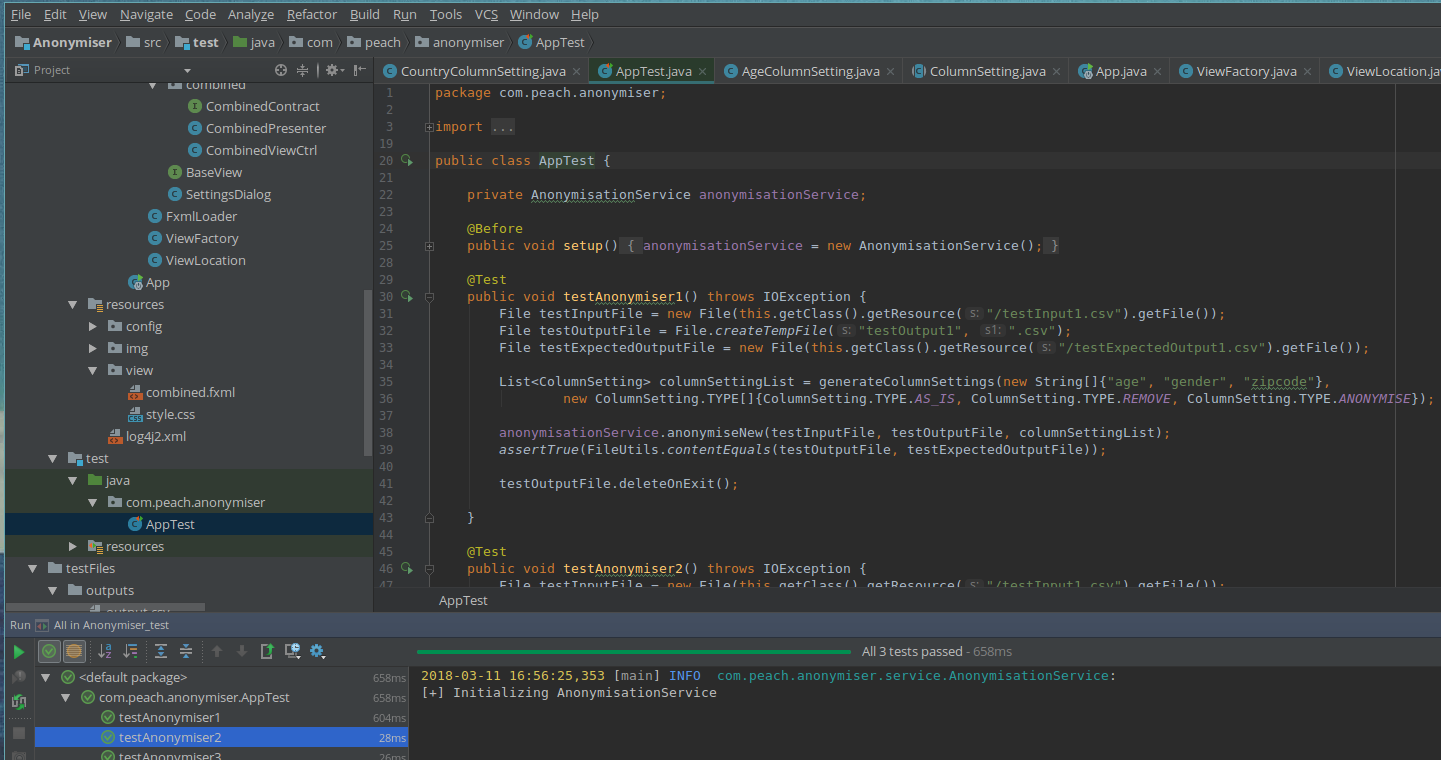
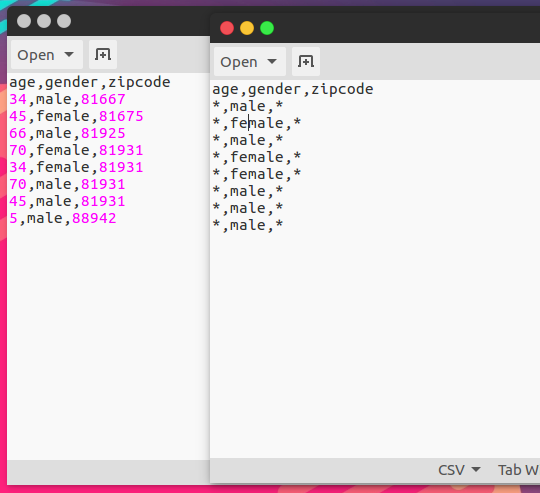
We used a sample input csv file and ran it through our data anonymiser. We compared the output with the input to make sure that the anonymiser produced a good result.
Next we uploaded the output file to the core analytics system. We entered the NiFi user interface to make sure that the file was actually uploaded to the core analytics system.
NiFi sends the file to Kafka, so we checked the Kafka logs to make sure that Kafka indeed received that file.
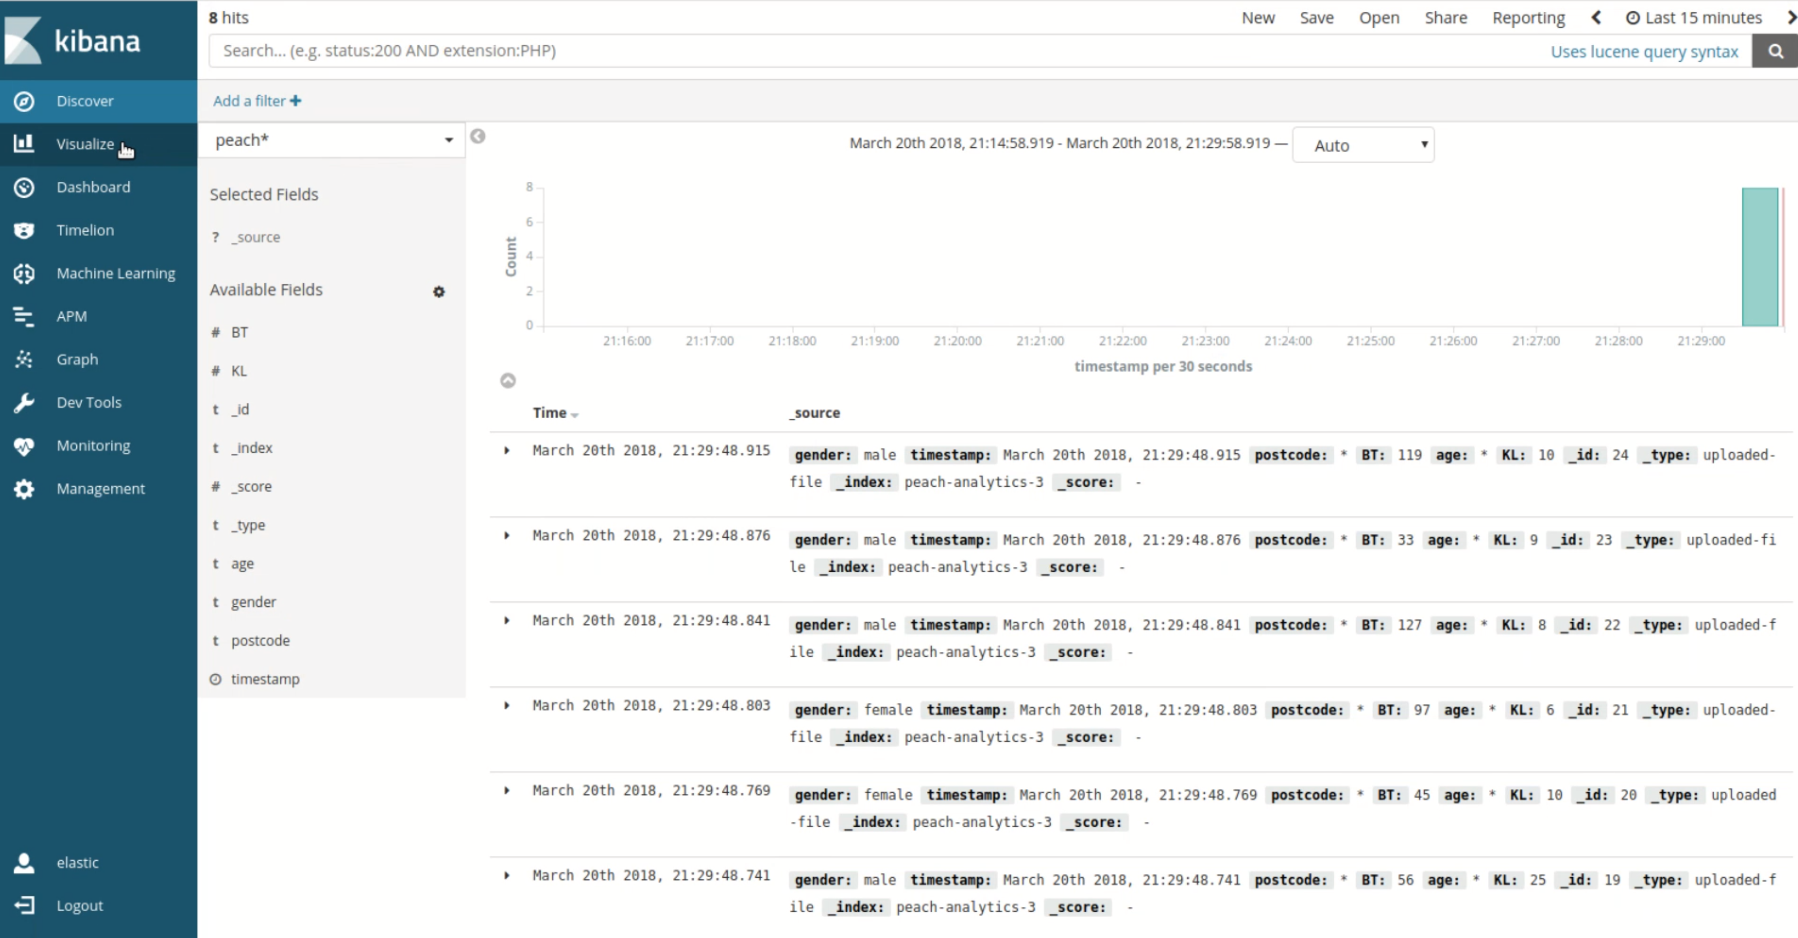
Our visualiser tool receives the data file though Kafka and Elastic stack. To verify that the file is available in the visualiser we opened the web interface of our solution and viewed the raw incoming data. This correct data was present, so we then created graphs to make sure that the visualiser can actually generate graphs based on the incoming raw data and our selected settings.
By following these steps we have verified that all parts of the system are working together as expected to produce the correct result for the user.
After making sure that the system is running locally, we deployed the system on Azure and used the same approach to test the whole system in the cloud. Just like on our local machine, the system worked as expected on Azure.
Furthermore, we have written scripts to automate deployment and have tested their functionality.
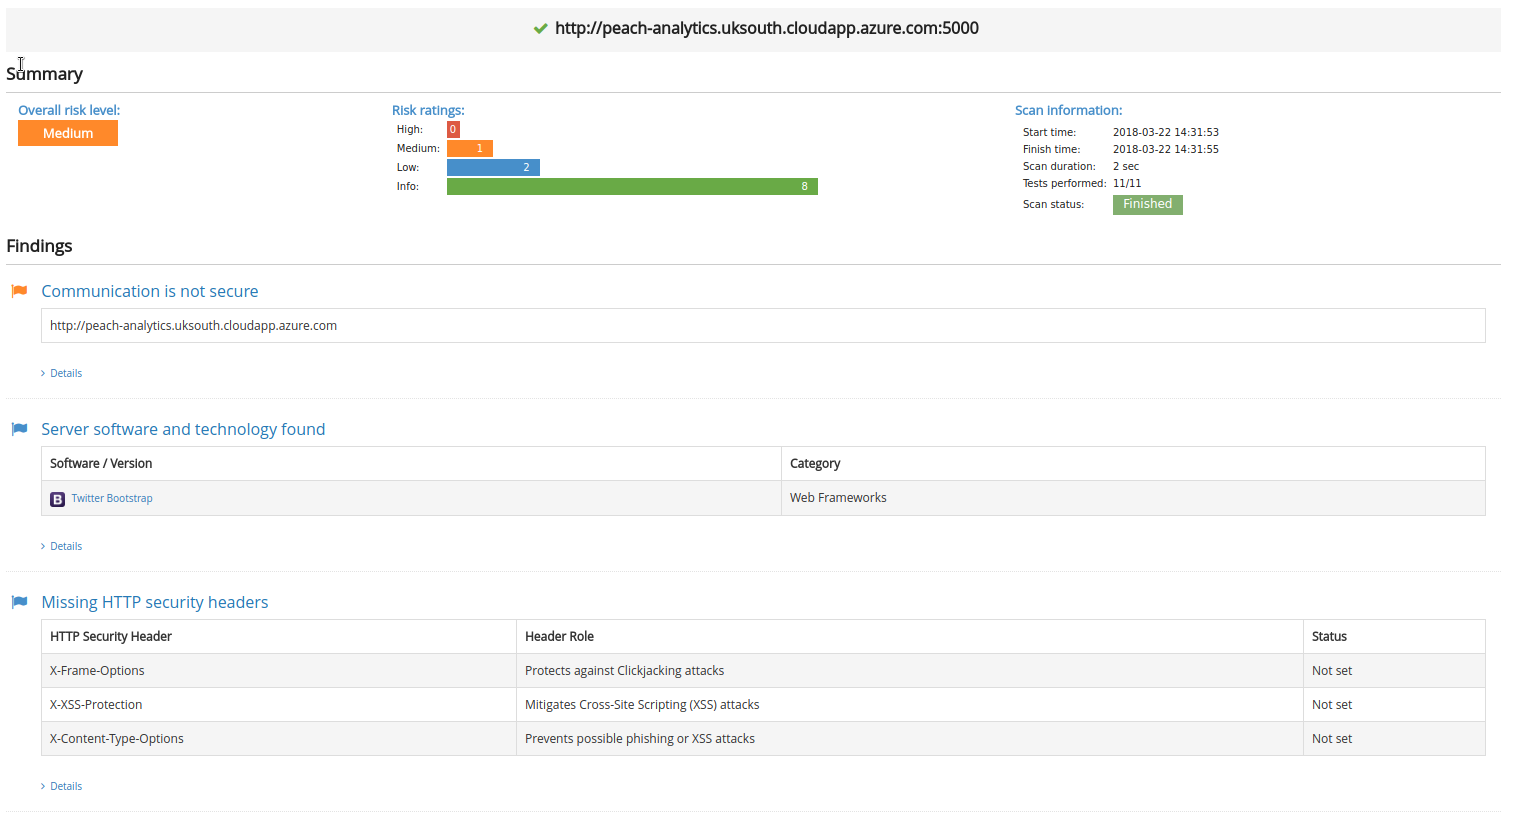
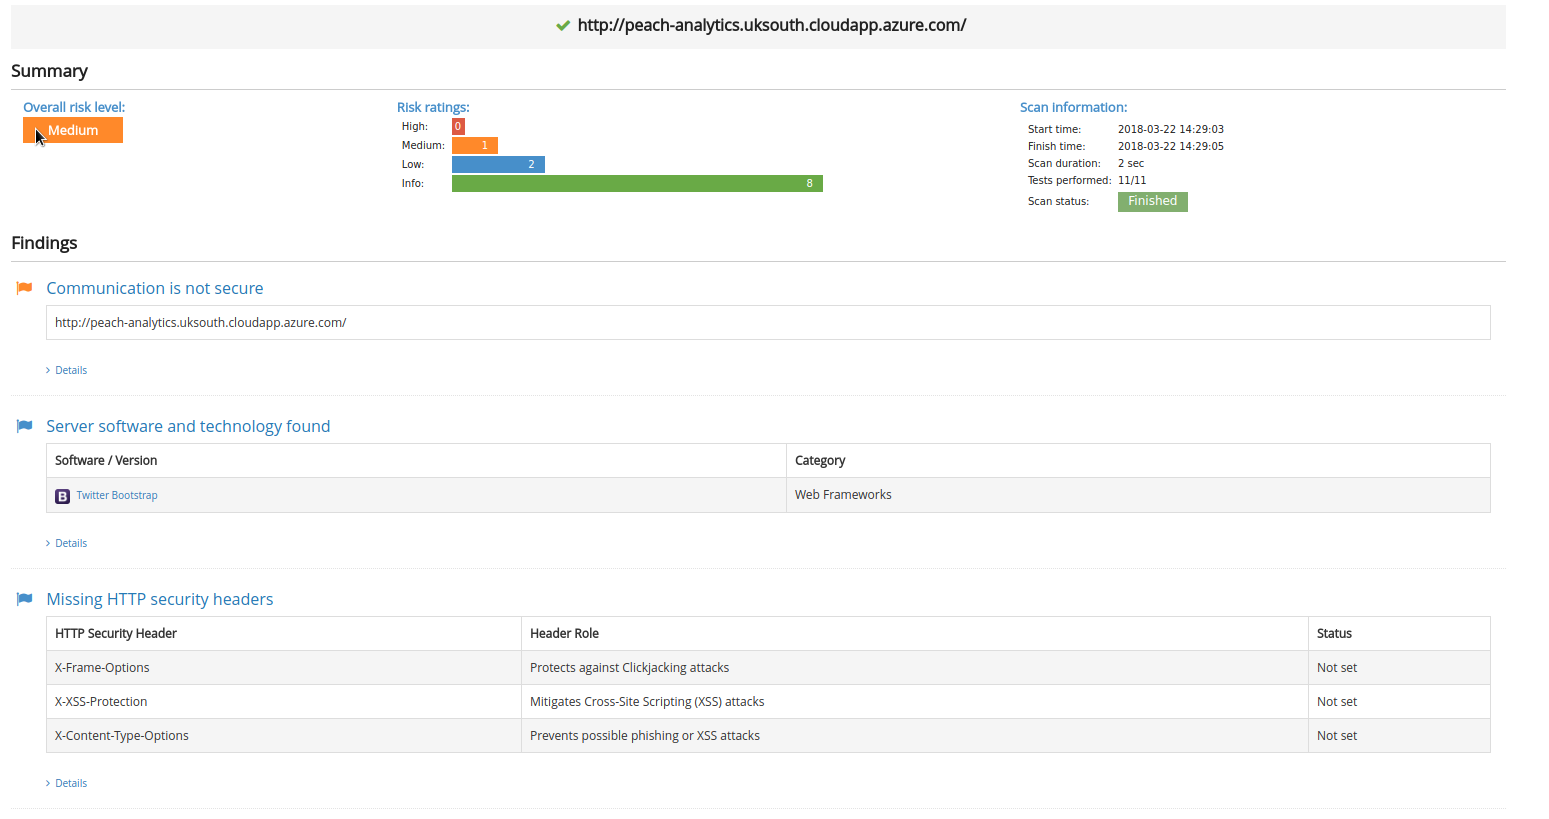 With a medium risk level, the security vulnerabilities mainly related to this service are with the lack of TLS and some HTTP headers. As a result, it was decided that for the purposes of this protype, these vulnerabilities did not pose a big threat to the security of the system.
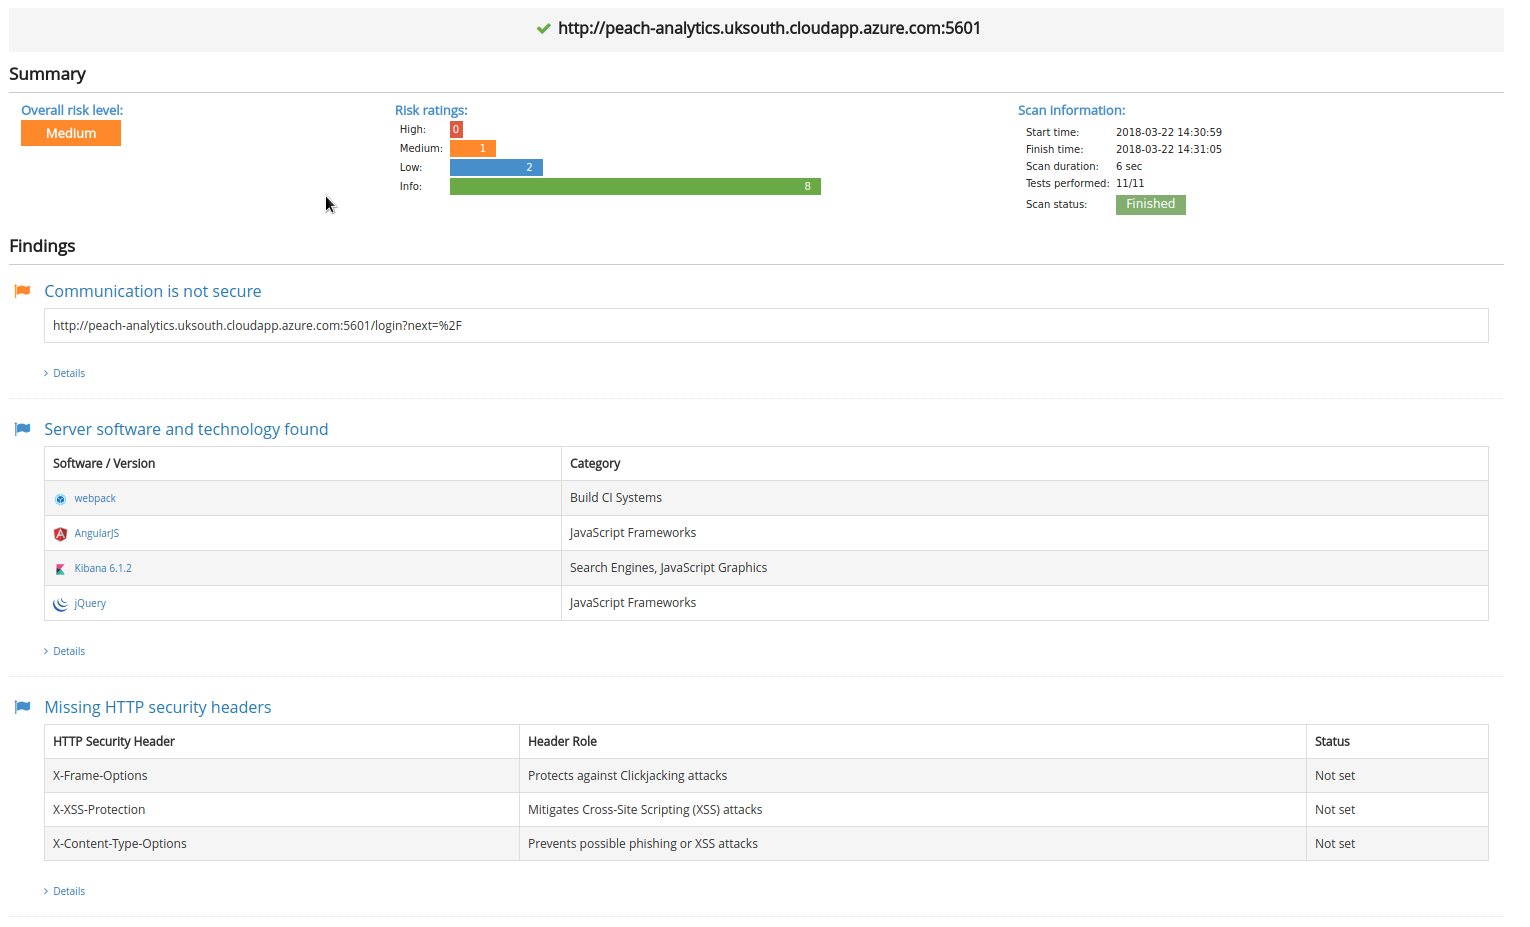
 The vulnerabilities mainly relate to the lack of HTTPS, missing HTTP headers and software information leakage. Again, it was decided that for the purposes of this protype, these vulnerabilities did not pose a big threat to the security of the system.
 With the lack of HTTPS, missing HTTP headers and software leakage, it was noted that for this project prototype, these security vulnerabilities would not impact the system's use.