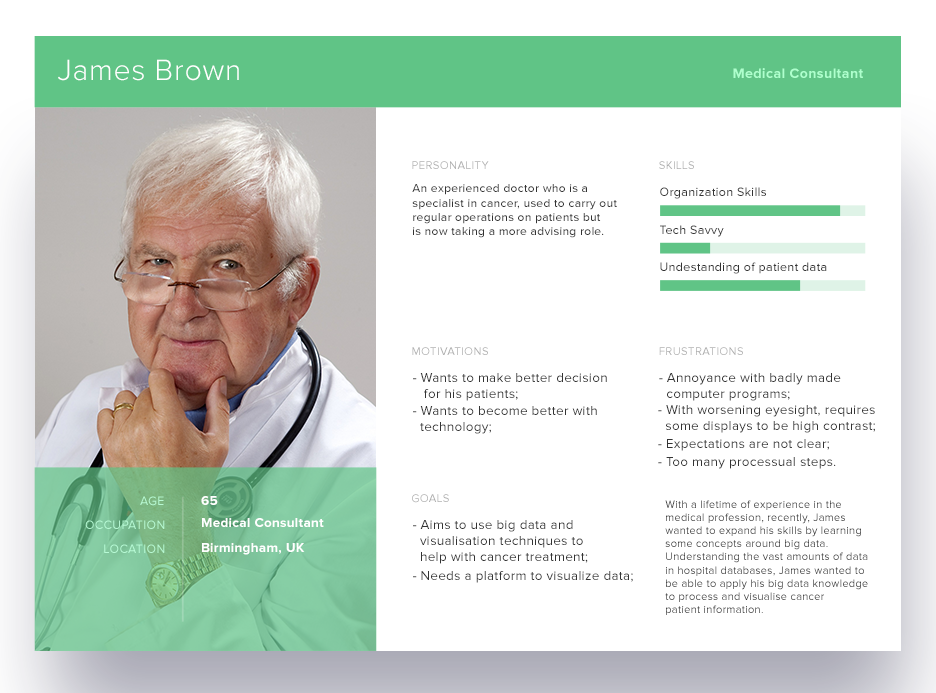
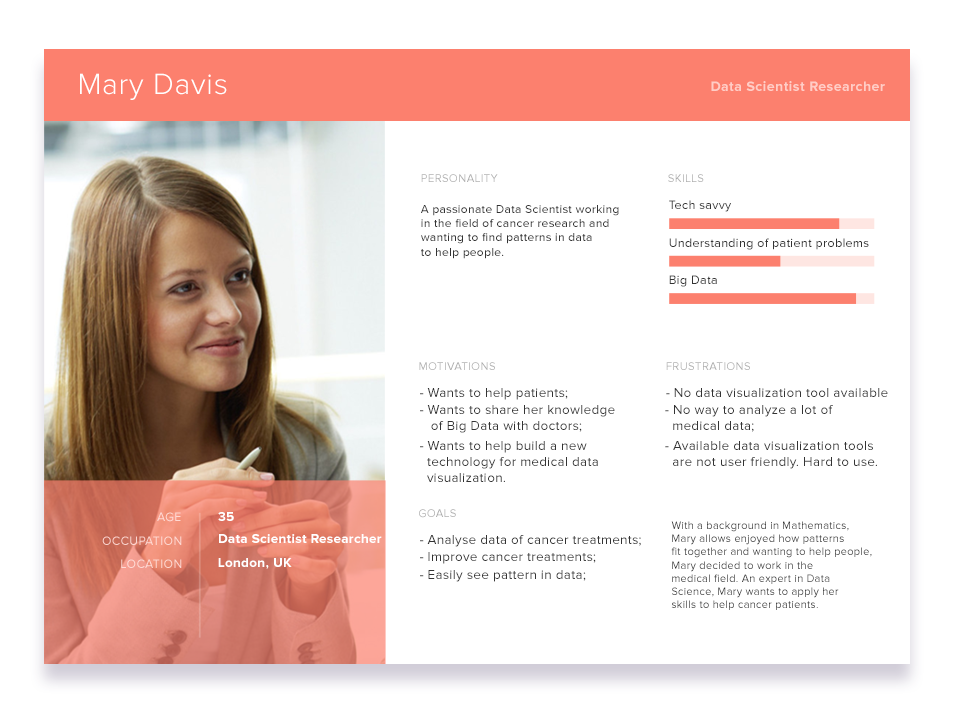
Personae
Thousands of people die from cancer every year in the UK. Although researchers work hard to find better and more effective treatments, millions of lives could be saved if research is conducted quicker and on a larger scale. Currently, most NHS institutions do not have access to a modern data analytics suite which would support automated anonymisation and analytics to be conducted on shared medical data. There is no suitable infrastructure to be used for activities such as capturing, transforming or transferring data across different systems. Due to the lack of a single, secure, open-source and an easy-to-use platform, existing applications for healthcare services are not widely used.
Working with our client, Dr Navin Ramachandran, who is a consultant radiologist at the University College London Hospitals (UCLH), we were tasked with developing a system which provides a platform which allows medical professionals and researchers to use. One which is able to anonymise sensitive patient information, carry out data science techniques and analytics before providing a customisable and interactive visualisation for users.
This project has been developed for PEACH, a large scale, open-source community with an aim to provide data science tools for medical professionals and researchers to aid them in diagnostic and analytics processes through the use of big data, machine learning and data visualisation.
This project has two primary goals. Whilst they may seem unrelated, both goals provide the core analytics system with methods to capture and visualise data, whilst also being able to be deployed as standalone products.
The first is to develop a data anonymiser tool, this is a piece of software designed to anonymise sensitive patient information for use in various areas of research and statistical records. This must be an application which is easily accessible to all medical professionals and researchers and must run on most platforms since it is unknown what operating system the user will be using.
The second primary goal is to further develop PEACH’s core analytics system by providing a visualisation solution. This visulisation solution must allow users to interact with, customise and view data which can be provided from the PEACH analytics system.
Requirements for this project was gathered mainly through interviews and meetings with our client, Dr Ramachandran. Unfortunately, other information gathering techniques such as questionnaires and shadowing users was not possible due to difficulty scheduling time with users, the limited responses from questionnaires and privacy concerns.
Before the initial meeting with our client, we had prepared some questions to ask during the meeting and the questions and their answers are recorded below.
- What's the project about?
This project is all about data analytics and setting up a system for medical institutions to be able to use advanced data science techniques to analyse lots of their data. There are currently no equivalent systems in place but this can be something that can really change research. Additionally, another part of the project is data anonymisation, this is a piece of software which anonymises patient information but can also be used to generate novel data from the provided information.
- What are the objectives of the project?
The main objectives to this project are to implement additions to the current analytics infrastructure and to develop the anonymisation software. The current analytics system use technologies including Apache Kafka and Apache NiFi. Currently, the system receives and preprocesses data in NiFi before passing it onto Kafka which is a messaging hub. In terms of this analytics infrastructure, this project should aim to integrate technologies such as Kibana and Elasticsearch into the system. Another main objective is to develop the anonymisation software which can be used to anonymise datasets so that it can be used to analytics systems.
- Who are the users?
There are two main groups of users for the core analytics system, and they are medical professionals and researchers who wish to access the analytics data through an interactive and graphical visualisation. The users of the anonymisation software will be doctors who have access to sensitive patient information, they will use this to remove sensitive information from data they have access to before uploading the data to systems such as the core analytics.
- Can we talk to the users?
Unfortunately, the team will not be able to talk with users due to privacy concerns as well as difficulty scheduling time with them. However, should potential users be interested in the project and wish to reach out to the team, Dr Ramachandran would pass on contact details.
- How do you want to interact with the project? e.g) Mobile App, Web App
The visualisation tool should be be available to users through the web so should be a web application. The anonymisation tool must support the many different operating systems and their different versions in use by the NHS today but could be either a desktop application or web application. However, sensitive information should never leave the user’s computer.
- Are there comparative products on the web already?
There are some existing analytics suites and anonymisation software but they are mostly commercial or very basic, and so project is all about creating something which is free and suitable for medical institutions.
- How can we store the data? Is the data sensitive? Access rules?
Data can be stored within the analytics system but all data must be non-sensitive. This means that the anonymisation software must provide enough privacy and users cannot be identified from the output. The visualisation aspect of the analytics infrastructure should have access rules to only allow authenticated users onto the system.
- Specific hosting required?
Since Dr Ramachandran has a large number of credits Azure account, the team should use Microsoft Azure to host the analytics infrastructure.
- How to test?
The analytics system should be tested using fake data, possibly from open-source datasets since it would not be possible to use real data due to privacy issues. This would be the same for the anonymisation tool but should a potential user be interested in running the software, then the team would be able have the software tested in a real environment with real data.
- Background knowledge (medicine) that we need to understand?
Since the technical aspects of the project are all technologically related, there is no need for any medical knowledge to understand the project.
- Who will own the intellectual rights to the finished project?
This project will be owned by PEACH and it will be up to the group who decides how to distribute the results of the project.
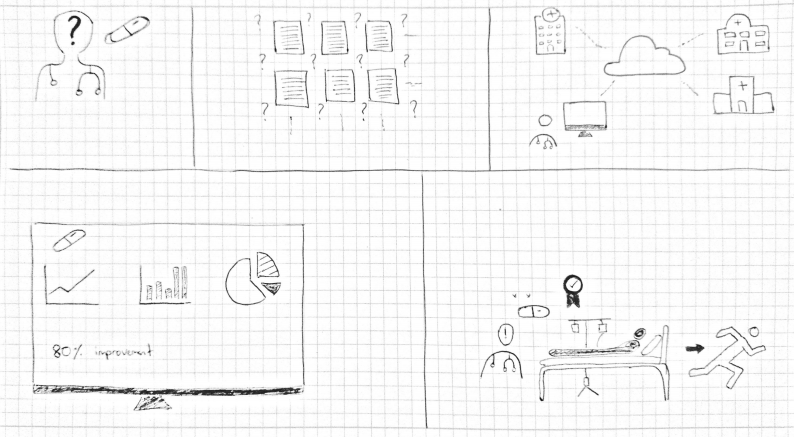
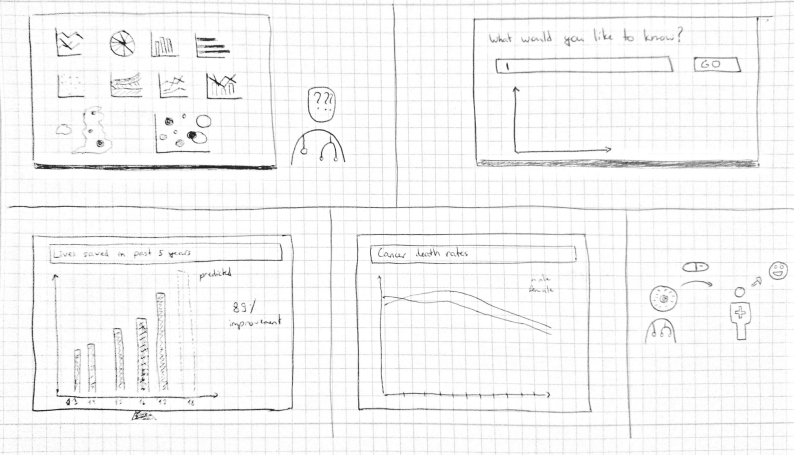
After the initial meeting, we analysed the information we had gathered and created an initial set of requirements using in the MosCoW style. A core part of our project involved extending the existing core analytics system and alongside understanding the infrastructure of the system by reading available documentation, we created personae, storyboards and use cases to recognise the needs of the user from their perspective. Examples of these are provided further down.
The requirements were later refined after research of competing solutions had been done, a better understanding of the project and its scope gained and further communication and discussion with the client carried out. Once changes had been made, they were confirmed with Dr Ramachandran as the final version, and we began the next phase of the project.
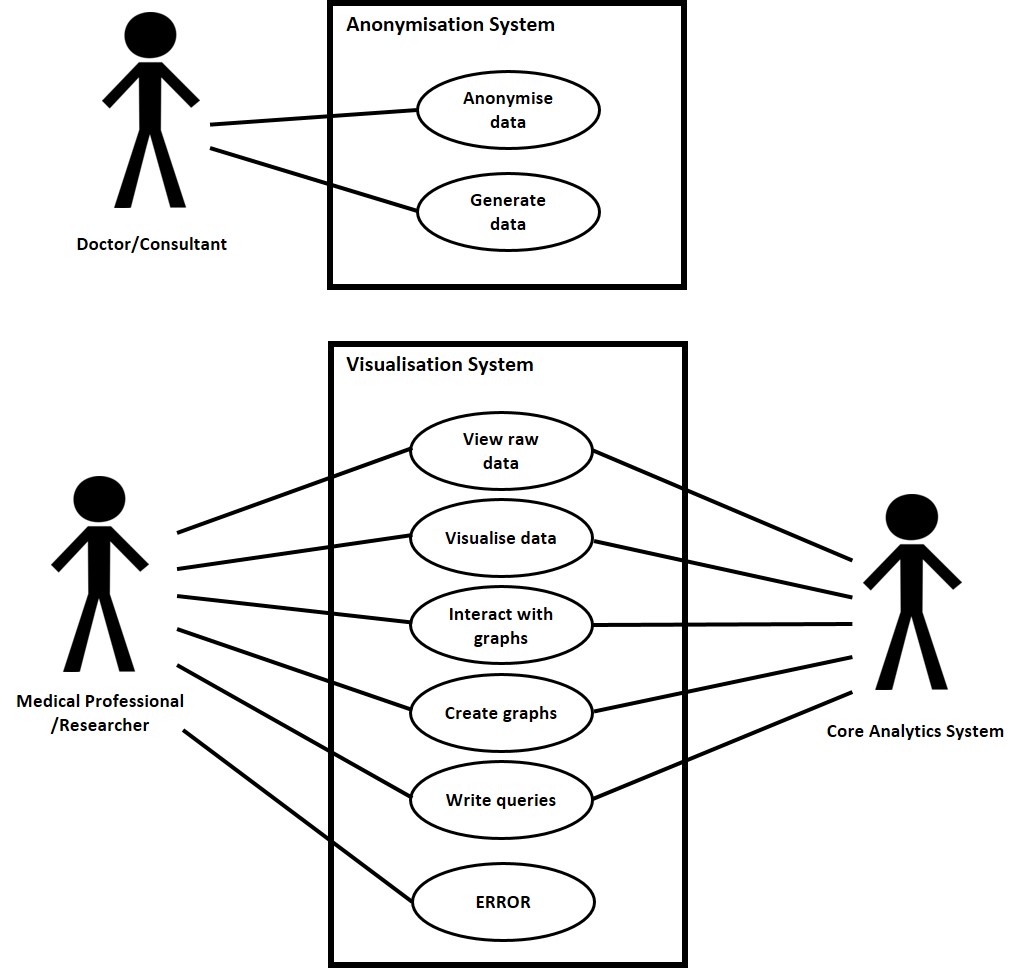
A user wishes to anonymise sensitive medical data.
Doctor/Consultant
Anonymiser System
User has opened the data anonymiser on their local machine and has switched to the anonymisation option.
The system resets the input fields and settings.
None
A user wishes to generate test data using an existing dataset.
Doctor/Consultant
Anonymiser System
User has opened the data anonymiser on their local machine and has switched to the generation option.
The system resets the input fields and settings.
None
A user wishes to view raw data within the PEACH core analytics system through the visualiser.
Medical Professional/Researcher
Medical Core Analytics Infrastructure
Visualisation System
User has opened the visualisation web interface and frontend has successfully connected with the analytics infrastructure.
None
UC8 ERROR
A user wishes to visualise the data within the PEACH core analytics system in graphical displays. The graphs and displays have already been created.
Medical Professional/Researcher
Core Analytics Infrastructure
Visualisation System
User has opened the visualisation web interface and frontend has successfully connected with the analytics infrastructure.
None
UC8 ERROR
A user wishes to visualise and interact with the data within the PEACH core analytics system.
Medical Professional/Researcher
Core Analytics Infrastructure
Visualisation System
User has opened the visualisation web interface, logged in and opened up a visualisation of data. The frontend has successfully connected with the analytics infrastructure.
None
UC8 ERROR
A user wishes to create new visuals displays within the PEACH core analytics system.
Medical Professional/Researcher
Core Analytics Infrastructure
Visualisation System
User has opened the visualisation web interface and frontend has successfully connected with the analytics infrastructure.
None
UC8 ERROR
A user wishes to write queries to gain further insight into the data.
Medical Professional/Researcher
Core Analytics Infrastructure
Visualisation System
User has opened the visualisation web interface and frontend has successfully connected with the analytics infrastructure.
None
UC8 ERROR
There is a system error with the core analytics or the visualisation web application.
Medical Professional/Researcher
Core Analytics Infrastructure
Visualisation System
User has opened the visualisation web interface.
None
None